Vanderbilt’s recent hosting of the Places & Spaces: Mapping Science exhibition, an international collection celebrating the use of data visualizations to make sense of large data streams in groundbreaking ways, proved to be not only intellectually enriching, but also socially unifying, according to several leaders across campus.
Works from the exhibition, which has traveled to 28 countries, have been on display the past three months in Sarratt Student Center, Rand Hall, the Wond’ry, and the Central Library. The prominence of these locations on campus enabled the exhibit to be seen by hundreds of faculty, students and staff members.
The Places and Spaces: Mapping Science exhibition brought together students, faculty and staff to celebrate technological advances in data visualization that facilitate our understanding of the world around us.
“The Places and Spaces: Mapping Science exhibition brought together students, faculty and staff to celebrate technological advances in data visualization that facilitate our understanding of the world around us,” according to Cynthia J. Cyrus, vice provost for learning and residential affairs. “From the disciplines of science and medicine to history, art, education and literature, the exhibition showcased how educational technologies can facilitate learning across a variety of disciplines.”
In partnership with the exhibition, John Sloop, associate provost for digital learning, and a group of 13 faculty, staff and students organized a program of special events focused on data visualization in support of the Education Technologies pillar of the Academic Strategic Plan. Through the exhibition, guest speakers, workshops and student awards students embraced new education technologies that fostered innovation in learning, teaching and discovery.
Learning
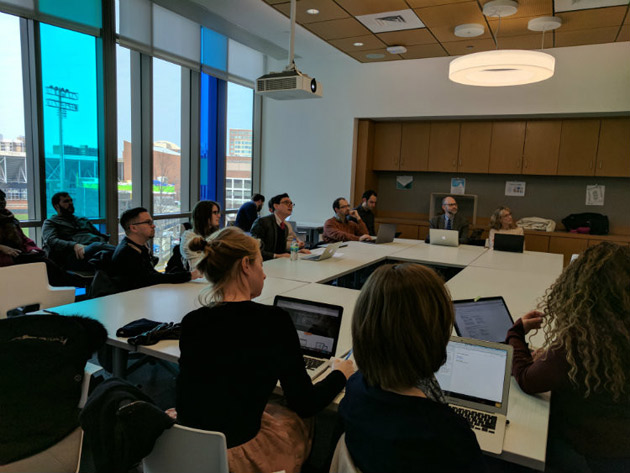
As part of the program, the Wond’ry welcomed 49 students to four data visualization workshops. In these classes, students learned about creating illustrations, interactive data analysis, visualizing data and how to use a GoPro camera.
Cliff Anderson, associate university librarian for research and learning and director of scholarly communications, said that in helping students learn to produce interactive plots with an open source programming language known as R, he hoped “participants left with a better understanding of the powerful visualizations that R packages can produce.”
Workshop presenter and theology and religion librarian Bobby Smiley said he was “excited that the Spaces and Places exhibition was complemented by workshops that surveyed similar terrain” and that conducting “instruction in the Wond’ry augmented the experience by helping to accent the university’s commitment to encouraging the use of innovative technology across disciplinary lines.”
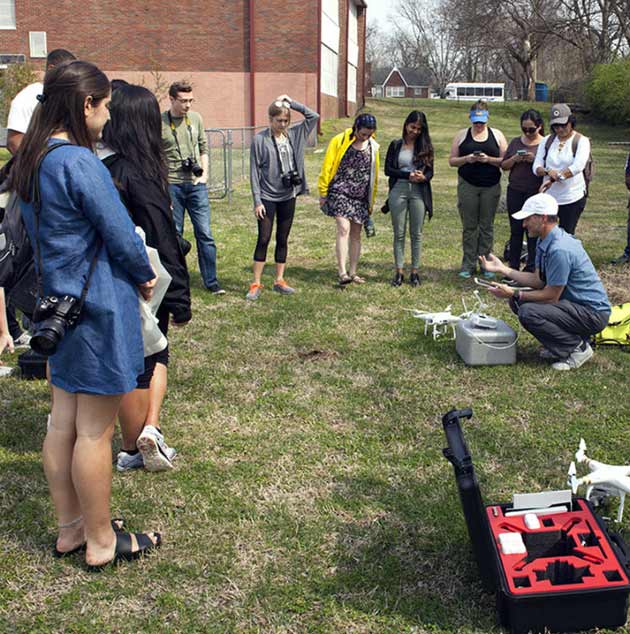
In addition to the four Wond’ry workshops, Seattle artist Tivon Rice conducted a site-specific workshop where students learned about Rice’s research and discussed technology’s relationship with memory, media and the mapping of contemporary urban space. As part of the workshop, students received hands-on experience mapping with drones.
Teaching
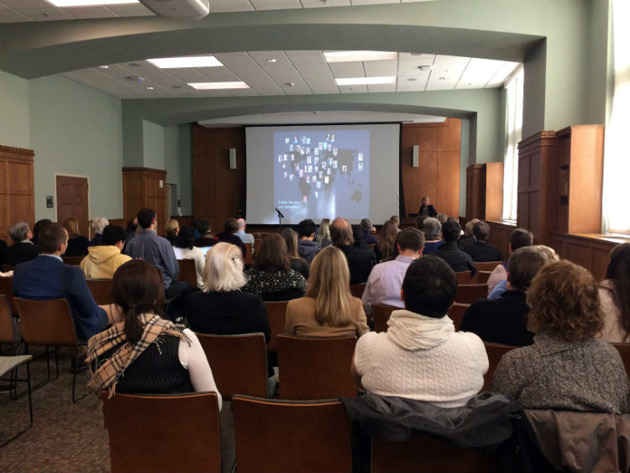
On Jan. 27 Katy Börner, curator of the exhibition and a distinguished professor of information science at Indiana University, taught an audience of 70 people about the power and versatility of map technology. She expounded on the history and significance of the exhibition and how the collection has evolved over time. Her lecture was recorded and is available via Vanderbilt YouTube.
Discovery
The final activity of the program was a competition in which students used innovation to present objects, ideas and data in a visual or nontraditional way. The discoveries presented by Ben Shapiro, a doctoral student in Teaching and Learning at Peabody College, and Blake Quigley, an undergraduate majoring in computer science, earned them first-place awards in the graduate and undergraduate categories. On April 13, they, along with other competitors, came together to receive awards, discuss their projects and to be inducted by alumnus David Blum, who graduated in 1977, into the Wild Bunch group.
The Wild Bunch Fund, established in 1997 to honor the late Chancellor Alexander Heard and his wife, Jean Heard, sponsored the Places & Spaces: Mapping Science program. Over the years, the Wild Bunch Fund has sponsored hundreds of books for the library, as well as lectures and special programs.
Places and Spaces was a unique exhibition blending art, technology and science and is an excellent example of the power of trans-institutional collaborations.
“Places and Spaces was a unique exhibition blending art, technology and science and is an excellent example of the power of trans-institutional collaborations,” said Robert Grajewski, Evans Family Executive Director of the Wond’ry. “The illuminated diagram display, hosted at the Wond’ry, gave visitors a chance to explore science and its impact on humanity in an interactive, visual way that is rarely possible.
“The visualizations in this exhibition highlight the geographic concentrations of research in particular topic areas around the world,” he said. “This global, ‘big picture’ view was both informative and impactful in demonstrating how and where innovative research to tackle some of the world’s biggest issues is currently occurring.”