Two student projects—one using the study of human movement over space and time, and the other an interactive webpage that explores the complexity of sorting algorithms—were the top winners in a Vanderbilt student data visualization competition held in conjunction with the campus exhibition Places and Spaces: Mapping Science.
The student competition was the final in a series of activities held this semester during the exhibition, which remains open in Vanderbilt’s Sarratt Student Center, Rand Hall, the Wond’ry, and the Central Library through April 23.
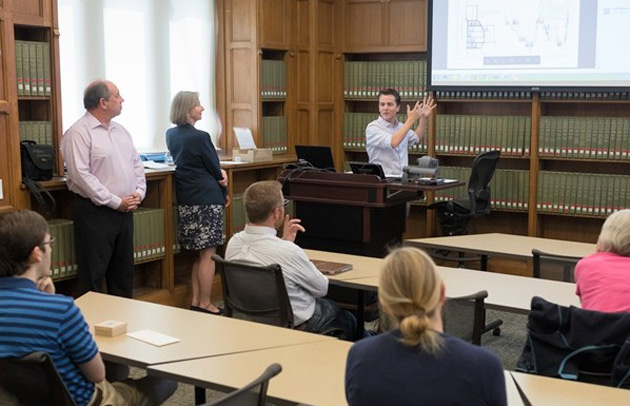
Nine students from a variety of schools and majors were recognized April 13 during a celebration of their work at the Central Library. “The overall goal of the competition was to present objects, ideas and data in a visual or nontraditional way that highlights trends or outliers and provides a unique representation of the information,” University Librarian Valerie Hotchkiss said. “All of our contestants certainly rose to the challenge.”
Ben Shapiro, a doctoral student in Teaching and Learning at Peabody College, received first place for Best Data Visualization by a Graduate or Professional Student for an entry related to his dissertation, “Interaction Geography.” One component of his project demonstrates how a 6-year-old boy runs back and forth across a museum gallery space in a frantic effort to lead his sister’s fiancé on a “pedagogical tour” of other exhibits there.
“This part of my visualization helps educators, researchers and designers see how young children’s erratic movement patterns in places like museums or school classrooms are not silly or foolish behavior,” Shapiro said. “Instead, these youngsters’ movements can reflect very intentional efforts to shape their own or other people’s engagement and learning.”
A second part of Shapiro’s project illustrates new types of technologies and collaborations with community partners to map people’s movement and conversation over space and time in relation to the design of physical spaces. “These maps can be used to organize complex forms of research data to address challenges like observing 12 children playing simultaneously in up to six different areas of the preschool classroom or playground,” said Shapiro, who is a member of Vanderbilt’s Space, Learning and Mobility Lab.
The Best Data Visualization by an Undergraduate Student award went to Blake Quigley, who is majoring in computer science in the School of Engineering, for exploring the complexity and nuances of sorting various algorithms with his interactive webpage. Quigley used the example of sorting five numbers in increasing order. “Ostensibly, this is a problem so trivial that no one would even bother to write it out,” he said. “Yet, beneath these billions of neurons that we call human intellect and intuition, would it be so easy to write out exact instructions capable of sorting any list? A human programmer must think with this level of scrupulous introspection to translate the brain’s abstract thoughts into machine code. A sorting algorithm is just one specific set of instructions that computer scientists have invented to consistently sort a list of numbers.”
The generated graphs on Quigley’s webpage show the size of a task on the x-axis and the time it takes to complete the task on the y-axis. “My website, along with a backbone of C++ and R computer programming languages, lets users choose from four sorting algorithms, six different data distributions, four different viewing modes and three different ‘order of complexity’ best-fit lines to understand the real-world, industry efficiency of different sorting algorithms in different situations.”
Examples Quigley gave of the need to sort big data could be an attorney with a corporate email account that has millions of emails that must be arranged chronologically, or a telescope that automatically sorts data by the likelihood of containing an Earth-like planet. “In these situations, the need to sort large arrays, or lists, becomes paramount,” Quigley said.
Other undergraduate student winners were:
- Trent Sexton, civil engineering, School of Engineering, second place;
- Ashley Rivera, civil engineering, School of Engineering; and Leyao Yu and Lin Fei, both math and psychology double majors in the College of Arts and Science, tied for third place.
Other graduate and professional student winners were:
- Ben Skinner, Department of Leadership, Policy and Organizations, Peabody College, second place;
- Qian Weiqiang, Department of Psychological Sciences, Peabody College; and Kate Brady, Department of Electrical Engineering and Computer Science, School of Engineering; tied for third place.
Other events during the exhibition included a keynote lecture by Katy Borner, data visualization workshops and a panel discussion on drone photogrammetry.
The exhibition and competition were sponsored by the Wild Bunch Fund, established in 1997 to honor the late Chancellor Emeritus Alexander Heard and his wife, Jean Heard. Representing the Wild Bunch at the awards ceremony was David Blum, one of the original seven founders who became fast friends with then-Chancellor Heard after arriving at Vanderbilt in 1973. At the students’ first meeting, Heard named them the Wild Bunch.
“In addition to our leadership roles on campus, we became known for having fun and pulling pranks,” Blum said. “However, our true legacy was our enduring friendship with Chancellor Heard and several initiatives on campus and in the community that continue to thrive. “These include the Wild Bunch Lecture Fund—formed to spark discussion and discourse on campus and to encourage people to think in less traditional ways.”
For more information, email Celia Walker.