By Paul Govern
One of the many things a person can do with a Vanderbilt University network ID and password is explore the Record Counter, or RC. Faculty, staff and students interested in medical records can ask the RC just about anything they’d like—as I have.
In a research database containing some 2 million de-identified patient records from Vanderbilt University Medical Center (around 18 years’ worth), there are, for example, 268 records indicating assault by human bite—136 females and 132 males. That was the count as of May 18, 2014.
I first noticed this tersely evocative patient label 13 months earlier, and it turns out the RC’s count has since risen, unhappily, by 22.
Researchers use the RC to check whether the database contains cohorts of sufficient size to probe a wide range of biomedical questions. To step any further into this secure, otherwise restricted data warehouse, as it’s called, investigators sign data-use agreements and obtain approval to pursue specific hypotheses.
Vanderbilt claims the world’s largest biomedical informatics enterprise. With great purpose and deftness, the university has turned its EHR (electronic health record) into an object of study.
 “The beauty of data analytics is that we can run initial experiments in data without involving any patients at all,” says Dr. Kevin Johnson, Cornelius Vanderbilt Professor of Biomedical Informatics, chair of the department and professor of pediatrics.
“That’s the really seminal observation that has been made by many industries before health care even got involved: that behaviors and patterns exist that can be predictable even without fully understanding why they occur, and if you can model those patterns, you can effect change.”
Most Americans have been familiar with the concept of data mining—the task of generating new information from large databases—as the enterprise behind Web searches or as a stratagem for predicting consumer behavior. In the medical research domain, by contrast, the pickings have been comparatively slight, with technology of the sort that powers commerce and banking missing from hospital rooms and clinics.
But no longer: The American Recovery and Reinvestment Act of 2009 included $19 billion for health information technology. This largesse, together with decreasing costs for DNA sequencing technology, spells employment for a certain type of data expert, and unprecedented opportunities for research.
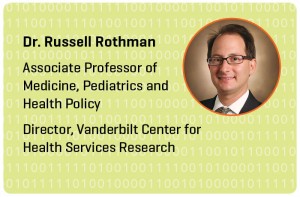
“Some studies suggest that we have rigorous evidence for only 15 to 20 percent of what we do in the hospital and clinic. The rest is opinion or extrapolation from other data,” says Dr. Russell Rothman, associate professor of medicine and director of the Vanderbilt Center for Health Services Research.
 Biomedical informatics is a science that draws connections between data and medicine, whether those data concern diseases, health care processes or human biology in the form of genomics and proteomics. Everyone who studies health records has the same goal: more precise medicine, leading to improved patient outcomes.
VUMC was a relatively early investor, adopting routine electronic record keeping in 1995. The Record Counter sits atop the Synthetic Derivative, where records are stripped of personal identifiers and, without sacrificing their scientific utility, are randomly altered to help prevent re-identification of specific patients. Under a program called BioVU, launched in 2007, de-identified records are linked to de-identified DNA samples representing 180,000 patients and counting.
At first, using electronic medical records to study disease can look like a hopelessly vexed proposition. Hospital and clinic documents are geared toward serving patients, care teams and billing departments. In relation to any disease states that may be present in a population, the data in medical records can be noisy and sparse. Data that spring up in the course of patient care may droop and fade under the lens of post-hoc data science. Clinical lab tests or other measurements that may be of interest seem to occur only irregularly, if at all. Diseases frequently sprawl atop one another—which is interesting, but renders everything less computationally distinct. Interpreting the occurrence of drugs is apt to call for some suspension of disbelief. Text, where some of the richest information is said to reside, requires sophisticated processing to yield computable terms, and the same goes for medical images.
Just as field biologists are prepared to contend with crocodiles and mosquitoes, data scientists who study medical records are prepared to overcome riotous uncertainty. Vanderbilt investigators are devising new methods for using medical records—or health records, as doctors are coming to call them—in rigorous analyses of health and disease.
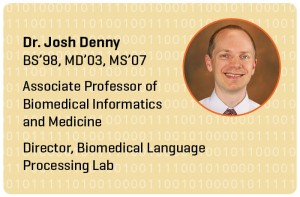 “As time goes on, the number of things you can analyze with genotype sets and electronic medical-record populations is limited only by the reasons people see their doctors,” says Dr. Josh Denny, BS’98, MD’03, MS’07, associate professor of biomedical informatics and medicine and director of the Biomedical Language Processing Lab. “The clinical data can be messy, but contain perhaps the single richest source of disease history, drug exposures and their response, and prognosis available for research.”
While VUMC has long been recognized as a hub for innovative data science, “the big difference during the past few years,” Johnson says, “has been that the computational tools are much more available, computational expertise is much more available, and computers in general are more capable, which has made some formerly impossible problems much more tractable.”
UNSUPERVISED, SEMI-SUPERVISED AND SUPERVISED LEARNING
All sorts of useful upstream signals of downstream risk are there for the finding in the EHR. In broad terms, one approach to these data is to set aside momentarily the clinical labels ascribed to patients in the hospital and clinic, to see where patients amass with regard to more stripped-down, straightforward information like clinical lab results and exposure to medications.
It’s a bit like looking through the wrong end of the telescope, but it’s human biology nonetheless. It involves circling back to view two graphs of the population, labeled and unlabeled. When these graphs are superimposed, a familiar label like, say, rheumatoid arthritis, might be seen to break up into population clumps, or may overlap with other diseases. Call that newly revealed structure a demonstration of unsupervised learning. The clumps and overlaps, interrogated in the lab, may or may not yield new biological or epidemiological stories.
Another approach—call it supervised learning—might start by using the EHR to infer clinical labels as carefully as possible, giving consideration to the full record and employing natural language processing to extract concepts from any text therein. Finding cases and controls in an EHR population—rheumatic and non-rheumatic, for example—can serve as a starting point for exploring the role of genetic variation or studying therapies. Unsupervised, semi-supervised and supervised learning work in concert.
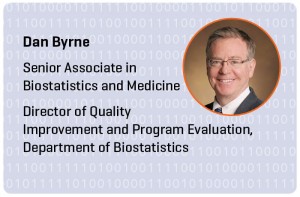 “Machine learning, unsupervised learning and artificial intelligence sound sexy but are no match for real intelligence with clinical input and real-time predictive models that have withstood rigorous validation,” contends Dan Byrne, a senior biostatistician at the Vanderbilt Center for Quantitative Sciences.
Under a program called Cornelius, Byrne and colleagues are testing the usefulness of EHR-based patient risk stratification. Randomized controlled trials using predictive models of pressure ulcers (bedsores) and hospital readmission (within 30 days of discharge) are underway in Vanderbilt University Hospital. In the pipeline are models of urinary tract infection, embolisms (blood clots), bloodstream infection and patient falls.
“We’re building the infrastructure to help Vanderbilt investigators move beyond simply publishing a paper about a predictive model to using it to improve outcomes in a sustainable way,” Byrne says.
Dr. Tom Lasko, assistant professor of biomedical informatics, arrived at Vanderbilt from Google in 2010. When a medical symptom is entered using Google, it fires search technology conceived and initially developed by Lasko.
“I thought Vanderbilt was the best place in the world for this kind of research, and I still think it’s one of the best,” he says.
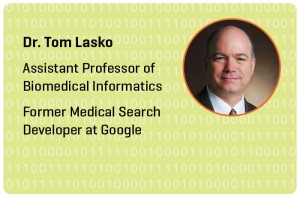 “Supervised learning is a great technique, but it only looks where you tell it to look, and you’re limited by your preconceived notions of what causes a given disease,” observes Lasko, who has led a demonstration of so-called “deep learning” on EHR data. It’s an unsupervised learning technique inspired by visual processing in the brain.
Lasko’s search for precision happens to begin far out in the land of hidden phenotypes. (If eye color is a trait, for example, then blue, brown or hazel eyes are phenotypes. Any feature or pattern in an organism might qualify as a phenotype, including states of health and disease.)
Lasko gathered records from 4,368 patients, half with gout and half with leukemia. Both types of patients experience elevated uric acid levels and receive repeated testing. To enable unsupervised learning on just these data, Lasko computed longitudinal probability distributions for each patient’s uric acid levels—that is, he transformed noisy, irregularly timed uric acid snapshots into continuous graphs that are more suggestive of underlying disease processes.
He processed this unlabeled information with a deep-learning algorithm, took the resulting population features as new inputs, processed those, and arrived at a Rorschach-like graph of the population. Then he retrieved the disease labels he had set aside and used them to color in the graph.
In this final picture, not only do gout and leukemia break cleanly apart—picture Lasko as Charlton Heston standing resolutely before Cecil B. DeMille’s Red Sea—but the two labels also break up into substructures. And the point of this demonstration is that these sub-groupings might carry meanings of their own.
“That I’m finding this clump, or this area in the data space where people seem to be congregating, is not a proof of anything,” Lasko explains, “but it’s a strong indication that something mechanistically common may be underlying that.
“You could hand this information to a geneticist or some other researcher. Or maybe this is an opportunity for a clinical trial,” he adds. “If we see a clump responding great to a particular drug for this disease, then maybe we should go straight to testing whether the effect is real and whether it could be used in clinical medicine.
“My point is that precise data-driven definitions of what a disease is are more likely to be correlated with the underlying pathophysiologic mechanism than our clinically driven definitions. I haven’t proven that yet—but that’s what I’m going after.
“My ideal setup,” he adds, “would be to have everybody’s information in the world.”
REDEFINING PHENOTYPES
When patients respond differently to the same drug for the same diagnosis, as happens so often, distinct phenotypes might be in play. A subtext of unsupervised learning on EHR data is that many more diseases may exist than are contemplated in current medicine.
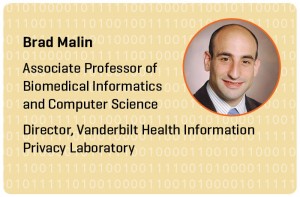 In a study now at press, Brad Malin and colleagues map an EHR population with reference to links they’ve managed to establish between individual drug prescriptions and their precipitating diagnoses. All clinical phenotypes are in play in this demonstration, and the one under examination is hypertension.
If this type of approach were to produce patient clusters that simply match known phenotype labels, then “fantastic,” Malin says, “but our expectation is that there’s much more complexity to these patients. We are investigating the nuance of what makes patients different so that we can redefine the phenotypes.”
Malin, associate professor of biomedical informatics and computer science, directs Vanderbilt’s Health Information Privacy Laboratory. Research on the EHR is a newish pursuit and, for Malin, the methodology itself is the story—it’s where the important novelty lies. But studies highlighting new informatics methodology are largely relegated to journals read only by other data scientists. Breaking through requires demonstrating a method in a population. “That’s one of the things Vanderbilt is capable of doing that a lot of other places are not,” he says.
A phenome is the sum of phenotypes to be observed in an individual or species. In a phenome-wide genetic association study, or PheWAS, appearing last year in Nature Biotechnology, Josh Denny and colleagues borrowed repurposed genotype data from 13,835 patients from five different medical centers around the country.
According to billing codes, these patients collectively exhibited 1,358 different diseases and conditions—that is, they represented the breadth of the clinical phenome. Denny focused on 3,144 common genetic variants already implicated in one disease or another, measuring the frequency of each variant in each disease group, comparing them to the general population.
The study replicated many known gene–disease associations. The real payoff, however, was the discovery of 63 previously unknown ones, each an example of a genetic variant having independent association with more than one trait—pleiotropy, as it’s called.
The New York Times covered the study as the first large-scale PheWAS.
“If you want to say this is a coming-out party for PheWAS, then it’s also in some ways a coming-out party for the electronic medical record as a tool for genetic studies,” says Denny, who had first demonstrated the feasibility of such a scan in 2010.
Denny and others at Vanderbilt also pursue the more familiar inverse approach of identifying subjects with and without a given disease, scanning the breadth of their genomes, and checking the frequency of genetic variants against the general population.
A 2011 study of hypothyroidism by Denny and colleagues was the first GWAS (genome-wide association study) of a disease using the EHR and repurposed genotype data from previous scans. “Our premise was, let’s see if we can basically do a ‘no genotyping’ GWAS,” says Denny. “Can we use what’s already on the shelf, pick another disease, and analyze it within those samples?”
Near a gene that codes for a thyroid transcription factor, they identified four common genetic variants as being highly associated with primary hypothyroidism.
These super-efficient approaches to discovery form the rationale behind the eMERGE (electronic medical records and genomics) Network, a national consortium of biorepositories linking DNA samples to de-identified medical records. Vanderbilt is the network’s coordinating center, and BioVU is by far the largest repository. According to a recent study, the median cost of BioVU studies is less than one-17th that of similar studies performed elsewhere, and while BioVU studies take a median time of three months to identify subjects, the median National Institutes of Health grant period for similar studies is three years.
The provisos attached to the $19 billion in federal incentives for health information technology include adding to the EHR more structured, machine-readable information about the clinical process. Meanwhile, “the only place you’re going to get the history of what brought patients to you, leading to a given diagnosis, is natural language processing,” says Denny.
Natural language processing (NLP) uses a combination of linguistic rules and statistics. In an example of machine learning, the computer digests an exhaustively hand-annotated corpus, yielding a statistical model of written English as used, in this case, in physician notes, nurse notes, messages from patients and so on. “If you want to look at what someone’s first presenting symptom was for multiple sclerosis, for example, that’s an NLP task,” says Denny. “If you want to know even when they were diagnosed, many times that’s also probably an NLP task.”
While commercial interest in clinical data analytics is bustling, some well-known companies have had only limited success moving new health-record technology.
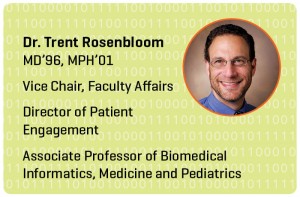 “The largest software companies are not making much headway into the electronic health-record space,” says Dr. Trent Rosenbloom, MD’96, MPH’01, whose research includes evaluation of health information technology. “Google shied away, Apple shied away, Microsoft has had limited usage.
“I suspect that some new startup that gets the right investor will disrupt the field,” Rosenbloom says. “My impression of where we’re going is that ultimately EHRs and related applications will become these very small, App Store-like things that live on your phone and do things that are highly individualized, and the data will all be fairly standardized and live elsewhere, in the cloud.”
It’s a far cry from where things stood back in 1998, when Vanderbilt’s rounded collection of experts in this field could fit around Dr. Bill Stead’s dining room table.
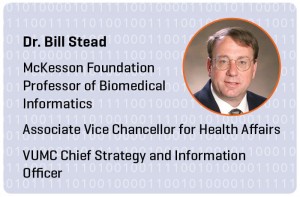 Stead is the McKesson Foundation Professor of Biomedical Informatics, associate vice chancellor for health affairs, and VUMC’s chief strategy and information officer. The fact that biomedical informatics is artfully sewn into both the clinical enterprise and the biomedical research enterprise is the consequence of a vision conceived and fostered by Stead these past 23 years.
“This stream of research gives us hypotheses, feature extraction and phenotype signatures,” says Stead. “Now let’s put that together. Let’s create a discovery platform that provides a gold standard to help us extract and export executable knowledge that can be incorporated into everybody’s electronic health systems and life management applications.
“The end-game vision,” he concludes, “is executable knowledge to support ‘whole person’ health and health care.”
Paul Govern, an information officer at Vanderbilt, writes about the VUMC clinical enterprise, including efforts to improve the quality, cost and safety of health care delivery. He also helps cover medical research, bioinformatics and clinical informatics at the Medical Center.
Watch a presentation by Bill Stead about electronic health records as a platform for research:
